The first anniversary of nvim-gdb
The first commit to nvim-gdb happened the 16th of August, 2017. So I may safely assume that it’s the first anniversary. The project has grown beyond my expectations really. So let’s review most notable milestones in its development.
Overview
Essentially, there is only a handful of requirements to a debugger plugin:
- Show the backend CLI
- Show source code with current frame location in a Vim window
- Show breakpoint locations in the source code
- Handle various short keys for the debugger commands
next,step,finishetc.
And the nvim-gdb does exactly that, but no more. It is assumed that all the other features are supported by the debugger backend. Like saving breakpoints, reviewing debugging history, assembly, registers, memory, you name it!
Diverse backends
It started as a ingenious thin wrapper around GDB to facilitate development of
Neovim: neovim_gdb.vim.
It turns out that GDB isn’t always
available (see the feature
request).
But the same idea could be applied to any CLI debugger, I thought. —Yes, and thus
:GdbStartLLDB was introduced.
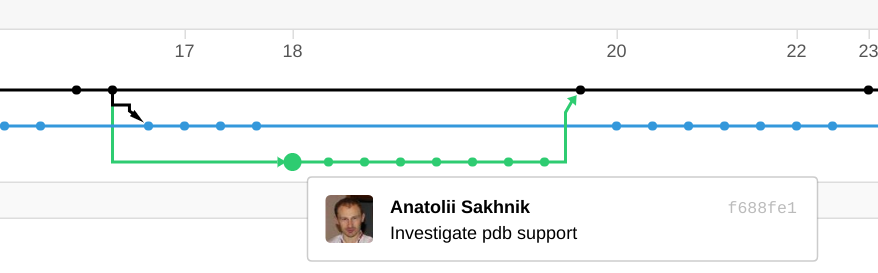
Then later on, when much of functionality was implemented in Python already, I needed to step through the test. So I step aside for a short time, and got PDB harnessed too. Although it behaves a little bit differently, yet still it’s completely usable.
Accurate breakpoints
While it’s easy to handle user hitting <f8>, it’s not so easy when a
breakpoint is set with a CLI command. One can setup a one-hit temporary
breakpoint, a conditional breakpoint and a lot more. And a breakpoint may
resolve to multiple places in the source code.
To show breakpoint signs in the source code accurately, the plugin would query breakpoint locations for the current file on every stop. On the other hand, the user shouldn’t be annoyed with unexpected debugger output, and the debugging history should be rather untouched. It’s done separately for different backends.
LLDB allows to spawn a thread, which would run a side channel for service
commands like info breakpoints. GDB doesn’t seem to allow that, but it’s easy
to bypass command history with prefix server. And the interaction with it can
be filtered out with a wrapper proxy application. So that’s how it worked out!
Careful UI
It was really easy to mess beyond reparation in the original plugin. Close a window, go to another tab while debugging etc. But now it’s a different story. The behaviour has been polished, any global state has been isolated to the debugging tab. So it’s even possible to conduct a couple of independent sessions simultaneously.
Keymaps have also been reworked. They are defined and undefined dynamically
depending on in which window the focus is. So if the debugging tab is left, you
wouldn’t be able to step through the code. Likewise, nvim-gdb’s keymaps wouldn’t
mess your own keymaps like ctrl-p.
Test suite
This is by far the most useful part to ensure practical stability of the plugin. The basic operation is tested carefully for all the backends. One now can be sure that whatever change is made wouldn’t introduce straight forward regressions while the tests are passing.
/tmp/nvim-gdb master
$ ./test/all.sh
Check for neovim     /usr/bin/nvim
Check for python3    /usr/bin/python3
Check for gdb        /home/sakhnik/work/dotfiles/src/.bin/gdb
Check for lldb       /usr/bin/lldb
Compiling test.cpp   a.out
..
----------------------------------------------------------------------
Ran 2 tests in 0.000s

OK
test_10_quit (test_10_generic.TestGdb)
=> Verify that the session exits correctly on window close. ... ok
test_20_generic (test_10_generic.TestGdb)
=> Test a generic use case. ... ok
test_30_breakpoint (test_10_generic.TestGdb)
=> Test toggling breakpoints. ... ok
test_35_breakpoint_cleanup (test_10_generic.TestGdb)
=> Verify that breakpoints are cleaned up after session end. ... ok
test_40_multiview (test_10_generic.TestGdb)
=> Test multiple views. ... ok
test_50_interrupt (test_10_generic.TestGdb)
=> Test interrupt. ... ok
test_10_detect (test_20_breakpoint.TestBreakpoint)
=> Verify manual breakpoint is detected. ... ok
test_20_cd (test_20_breakpoint.TestBreakpoint)
=> Verify manual breakpoint is detected from a random directory. ... ok
test_30_navigate (test_20_breakpoint.TestBreakpoint)
=> Verify that breakpoints stay when source code is navigated. ... ok
test_10_generic (test_30_pdb.TestPdb)
=> Test a generic use case. ... ok
test_20_breakpoint (test_30_pdb.TestPdb)
=> Test toggling breakpoints. ... ok
test_30_navigation (test_30_pdb.TestPdb)
=> Test toggling breakpoints while navigating. ... ok

----------------------------------------------------------------------
Ran 12 tests in 97.445s

OK

/tmp/nvim-gdb master 1m 38s
$
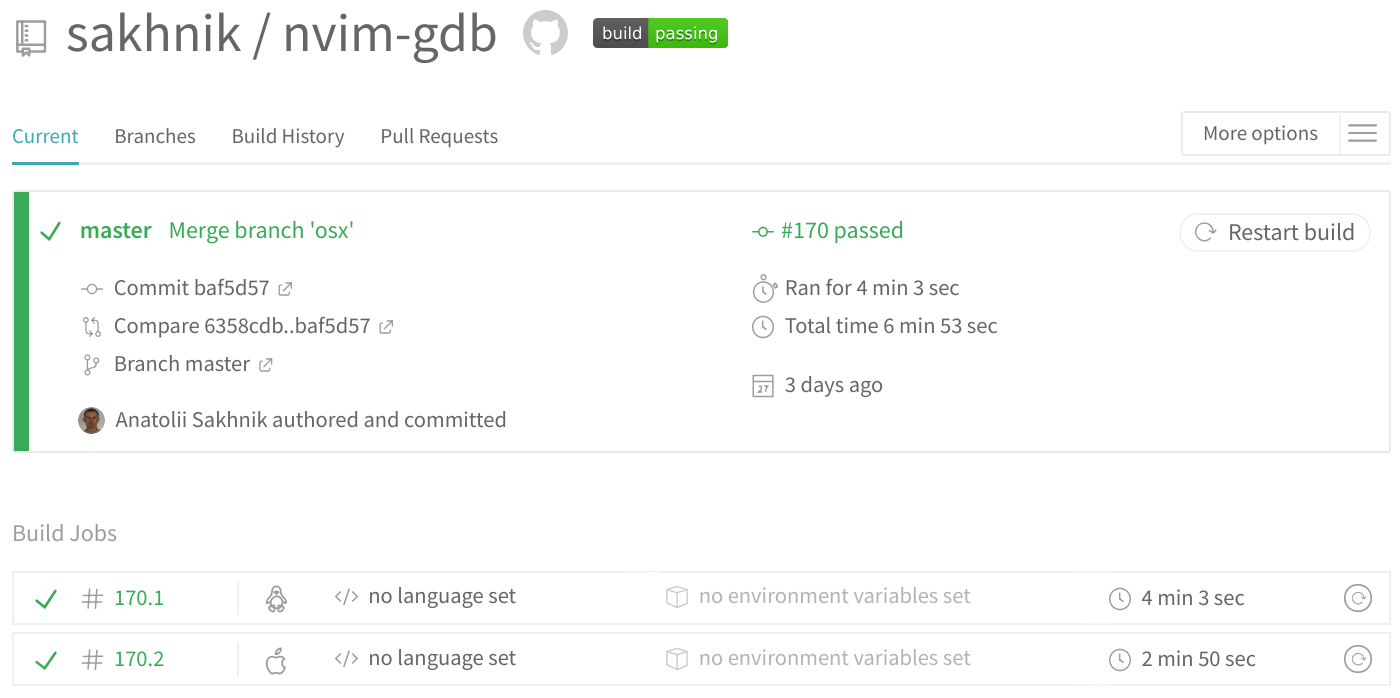
The same tests are run by Travis CI: nvim-gdb. The very recent addition was support for Darwin, so that the continuous integration is run for both Linux and Darwin. I was lucky to get it running without any MacOS, by the way!
Wrap up
Frankly speaking, I don’t need the debugger that often. But now I have one ready in my hands at all times. Surely, the development will continue. New features will be added, the existing ones will be polished. Please feel free to open issues or offer pull requests if anything is needed.